

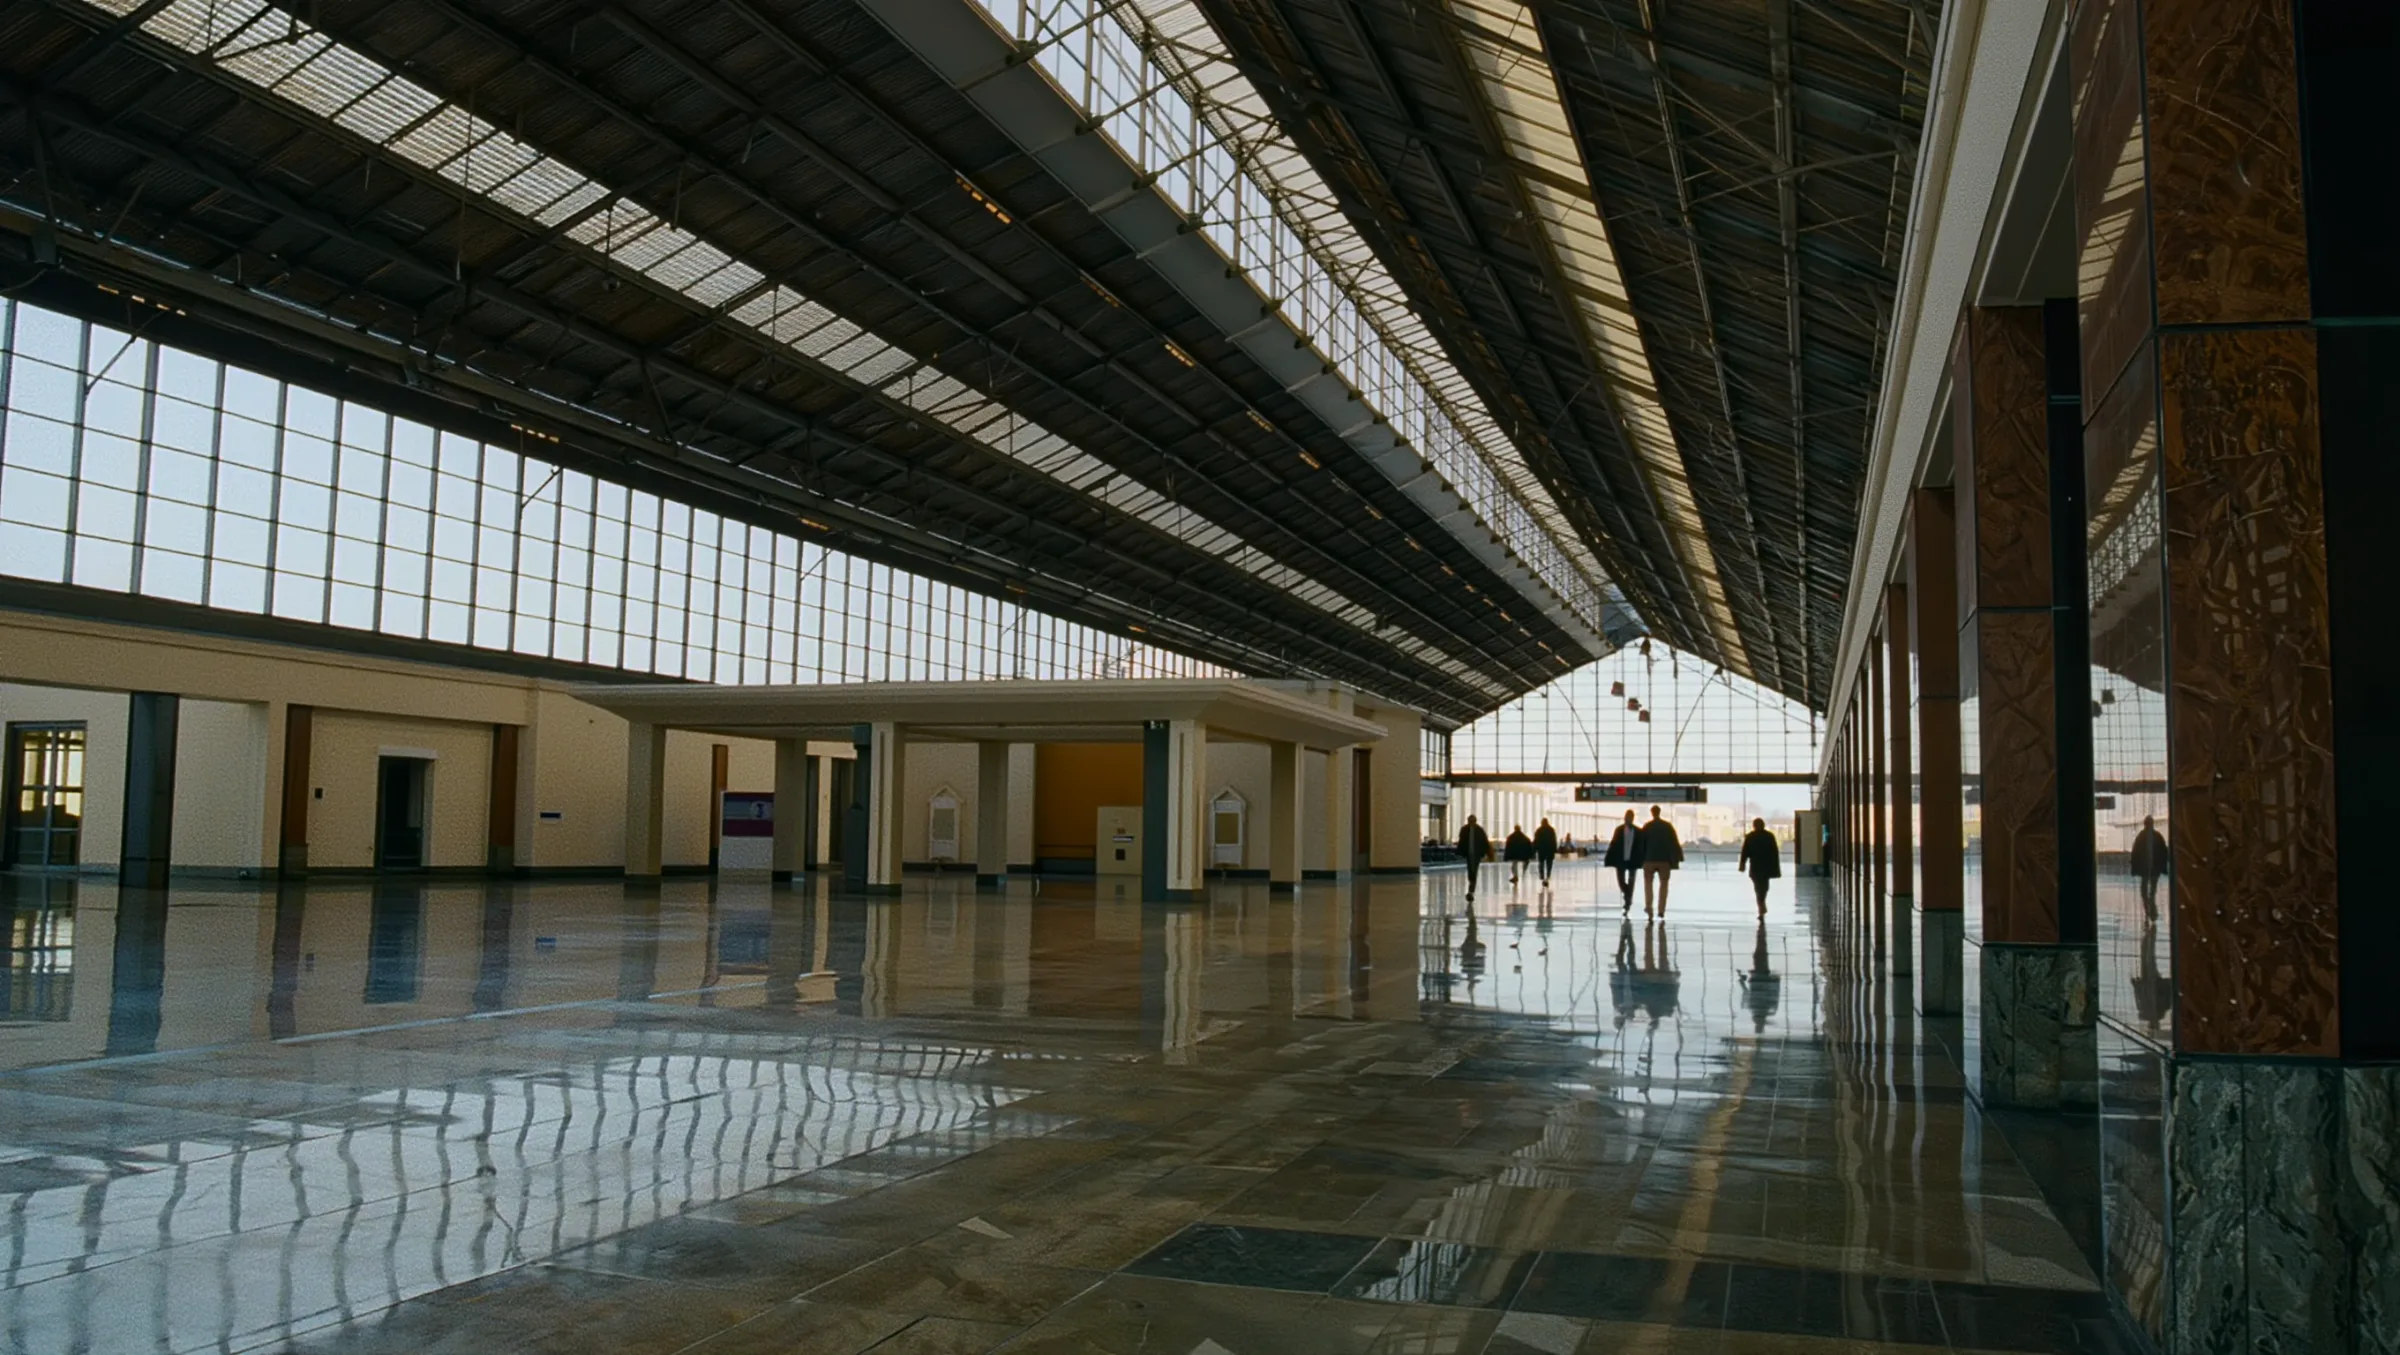
Passenger Flow for Transit Stations with 3D LiDAR
Quanergy 3D LiDAR counts and tracks every passenger across concourses, platforms and fare gates, anonymously and in real time, so operators see crowding as it builds and plan capacity on real data.
Fare data counts trips, not crowds
Fare gates tell operators how many trips started, not where passengers bunch up, how full a platform is, or how long lines are at the ticket machines. Cameras record images, but they do not turn into live flow data.
3D LiDAR adds the missing layer. Every passenger gets an anonymous track with position, direction and speed, across concourses, platforms, gates and vertical circulation.
The control room sees crowding as it builds. Planners get counts, dwell and flow by hour, day and month to size service and staffing.
Six ways 3D LiDAR works for transit stations
One sensing layer for operations, planning and passenger experience.
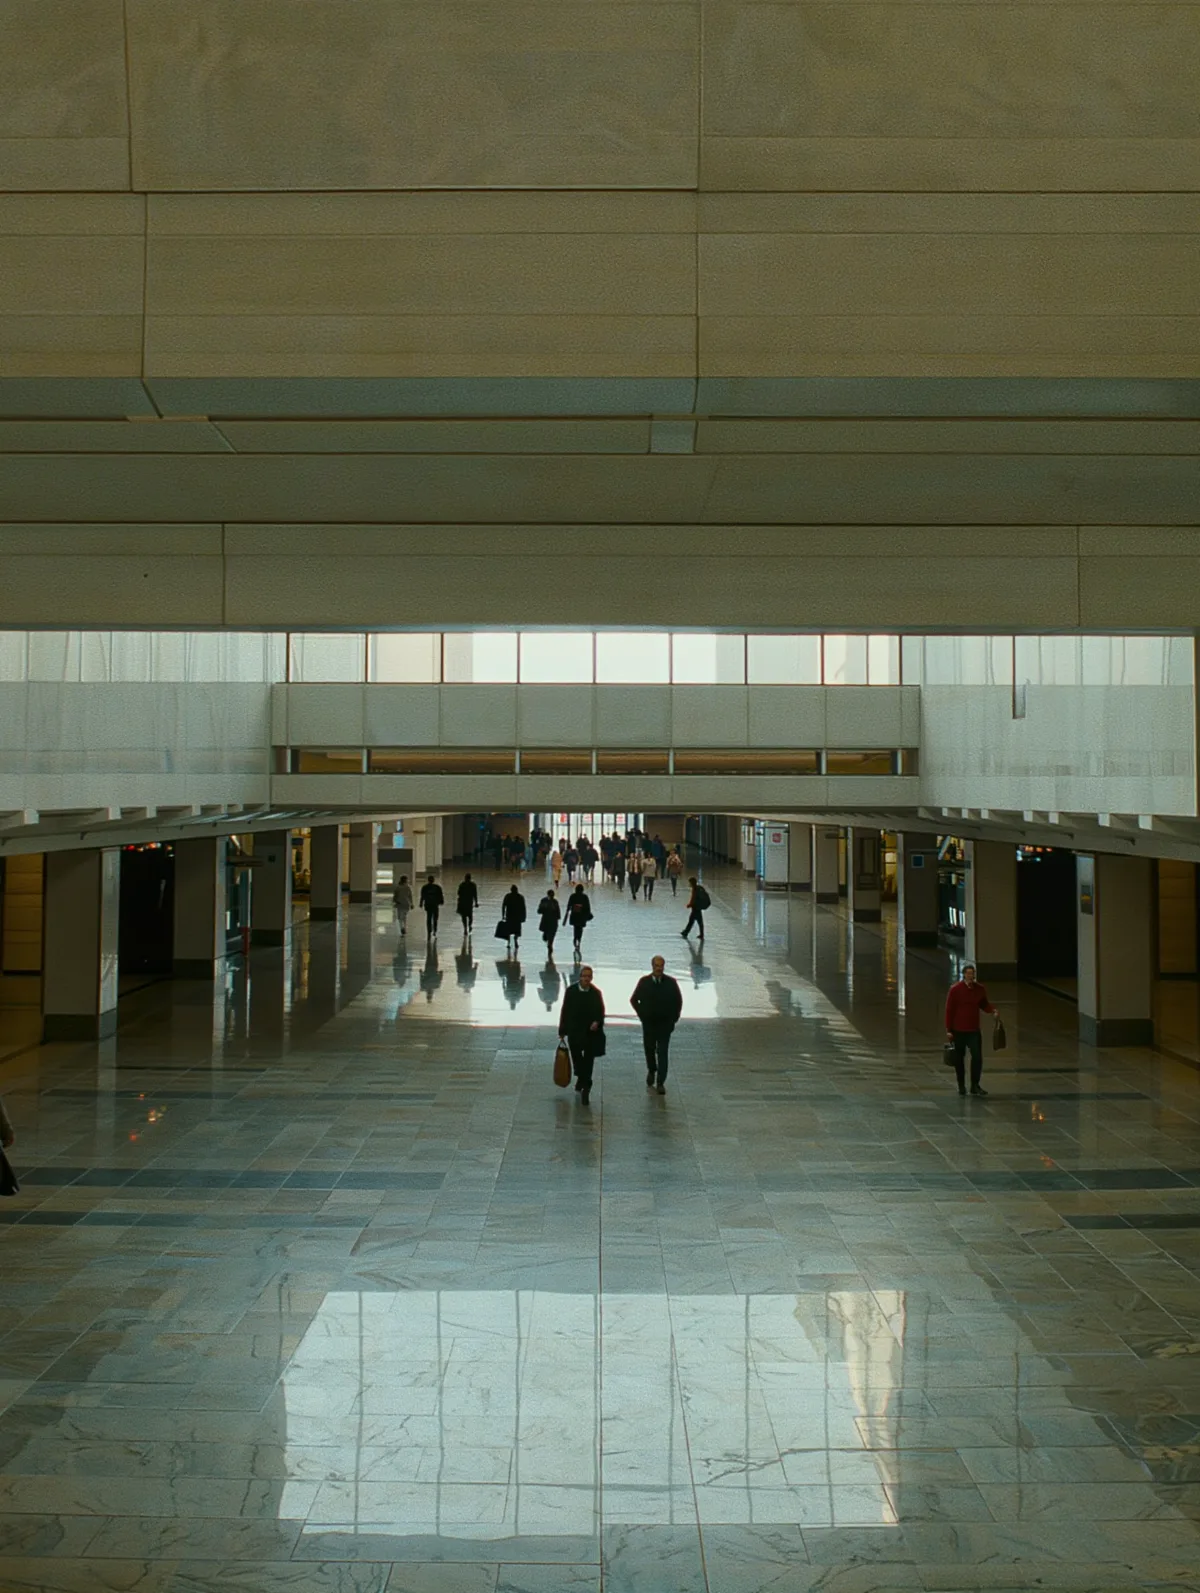
See crowding before it builds
Live density and flow across concourses show where passengers bunch up and which routes they take.
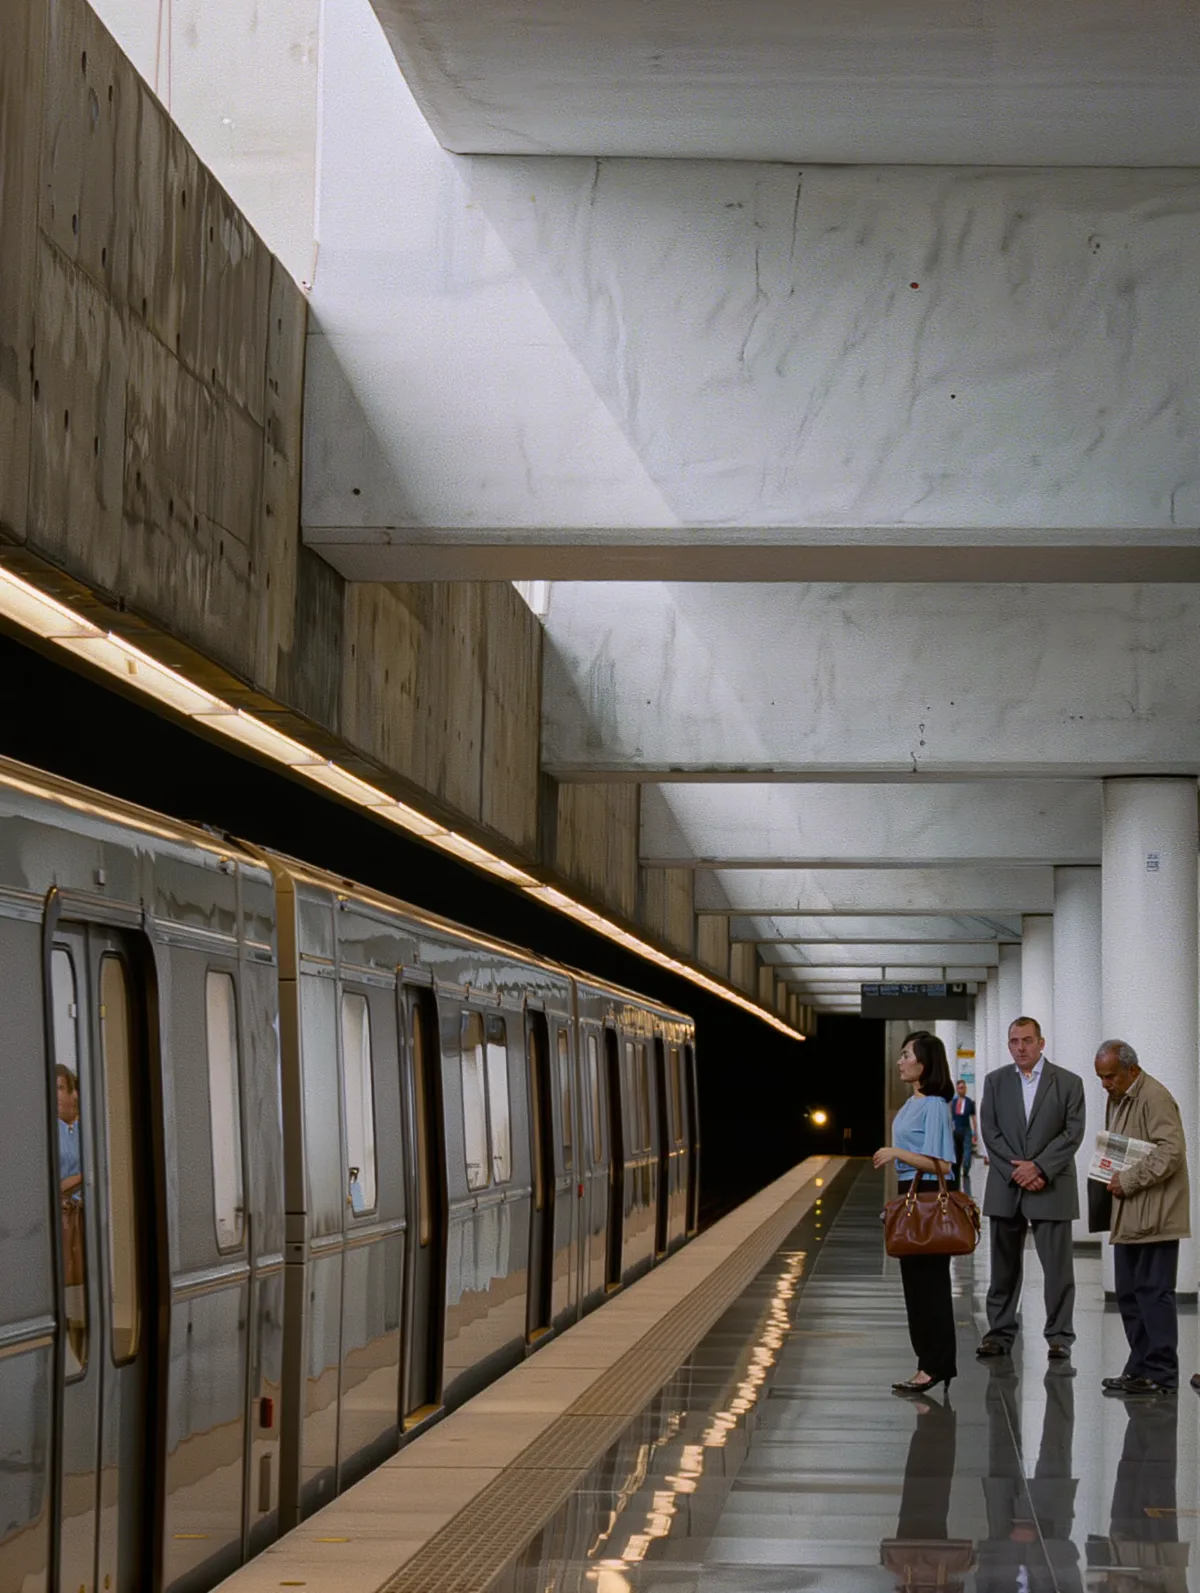
Know how full each platform is
Platform occupancy in real time, so operations can manage boarding and hold passengers upstream at peaks.
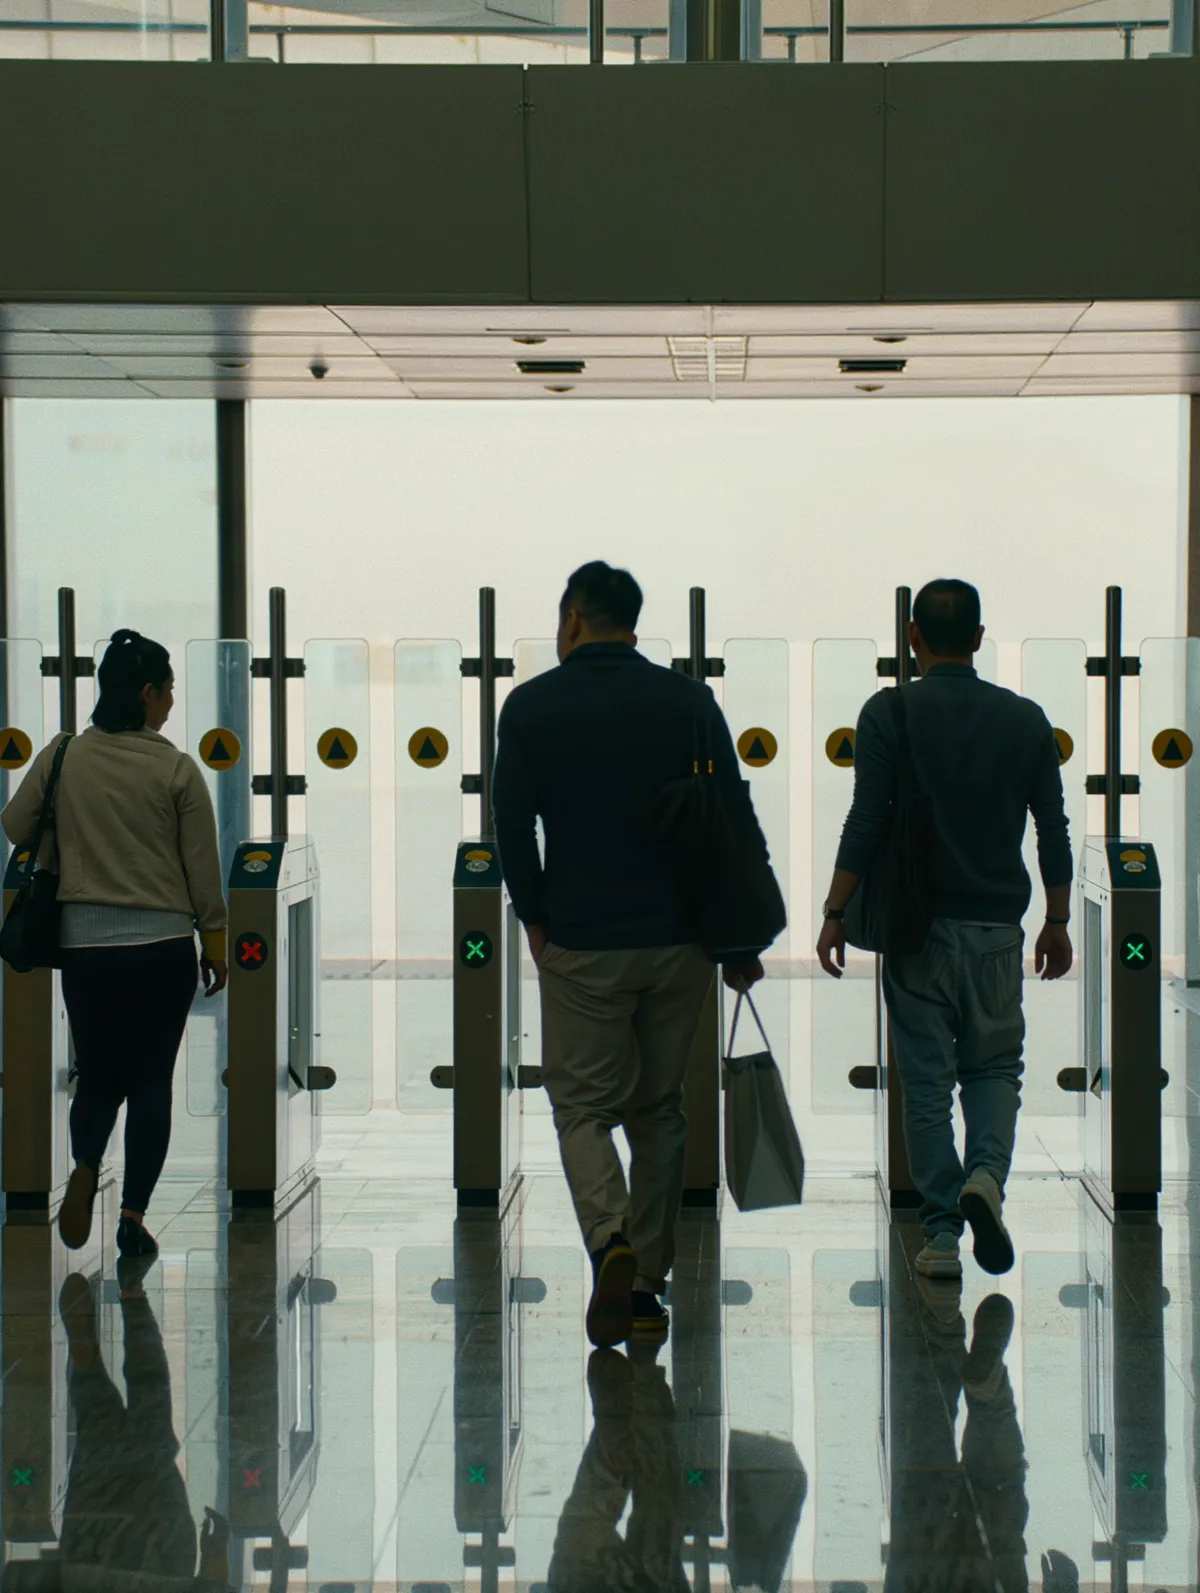
Count every passenger in and out
Entry and exit counts and throughput at each gate line and entrance, compared against past periods.
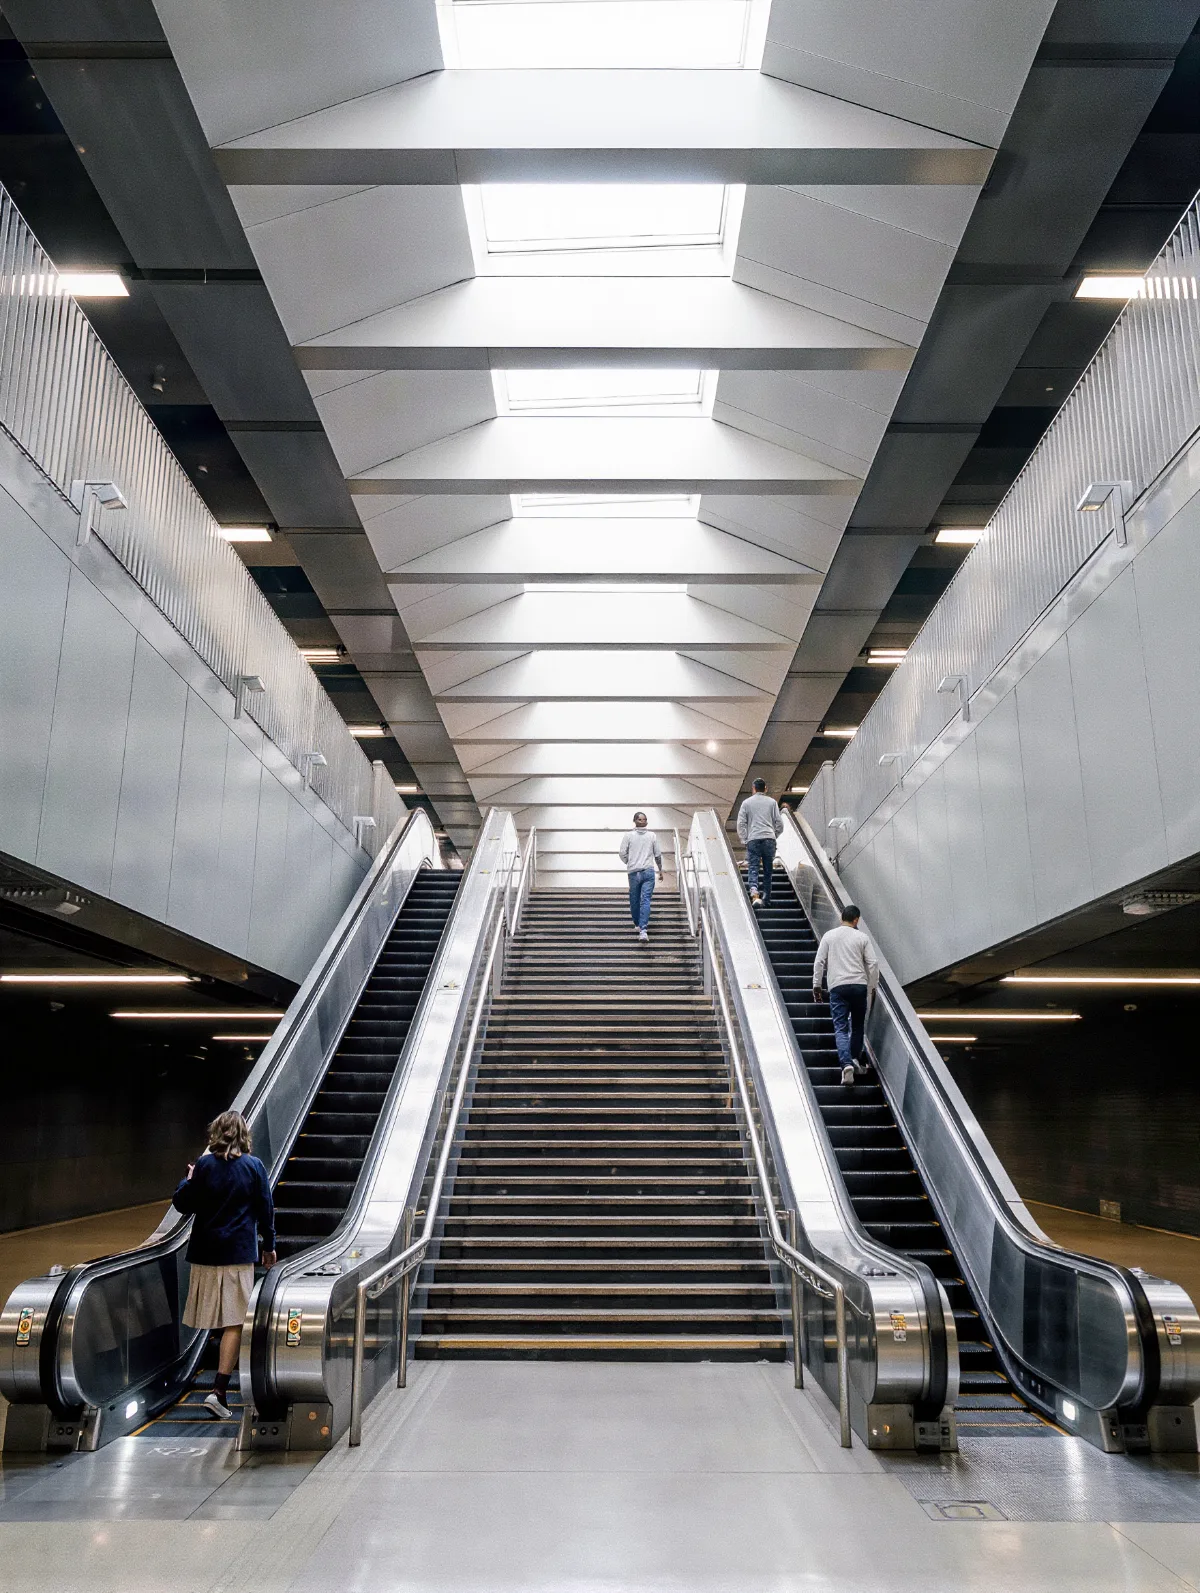
Spot bottlenecks at vertical circulation
Flow and dwell at stairs, escalators and lifts show where capacity runs out during the rush.
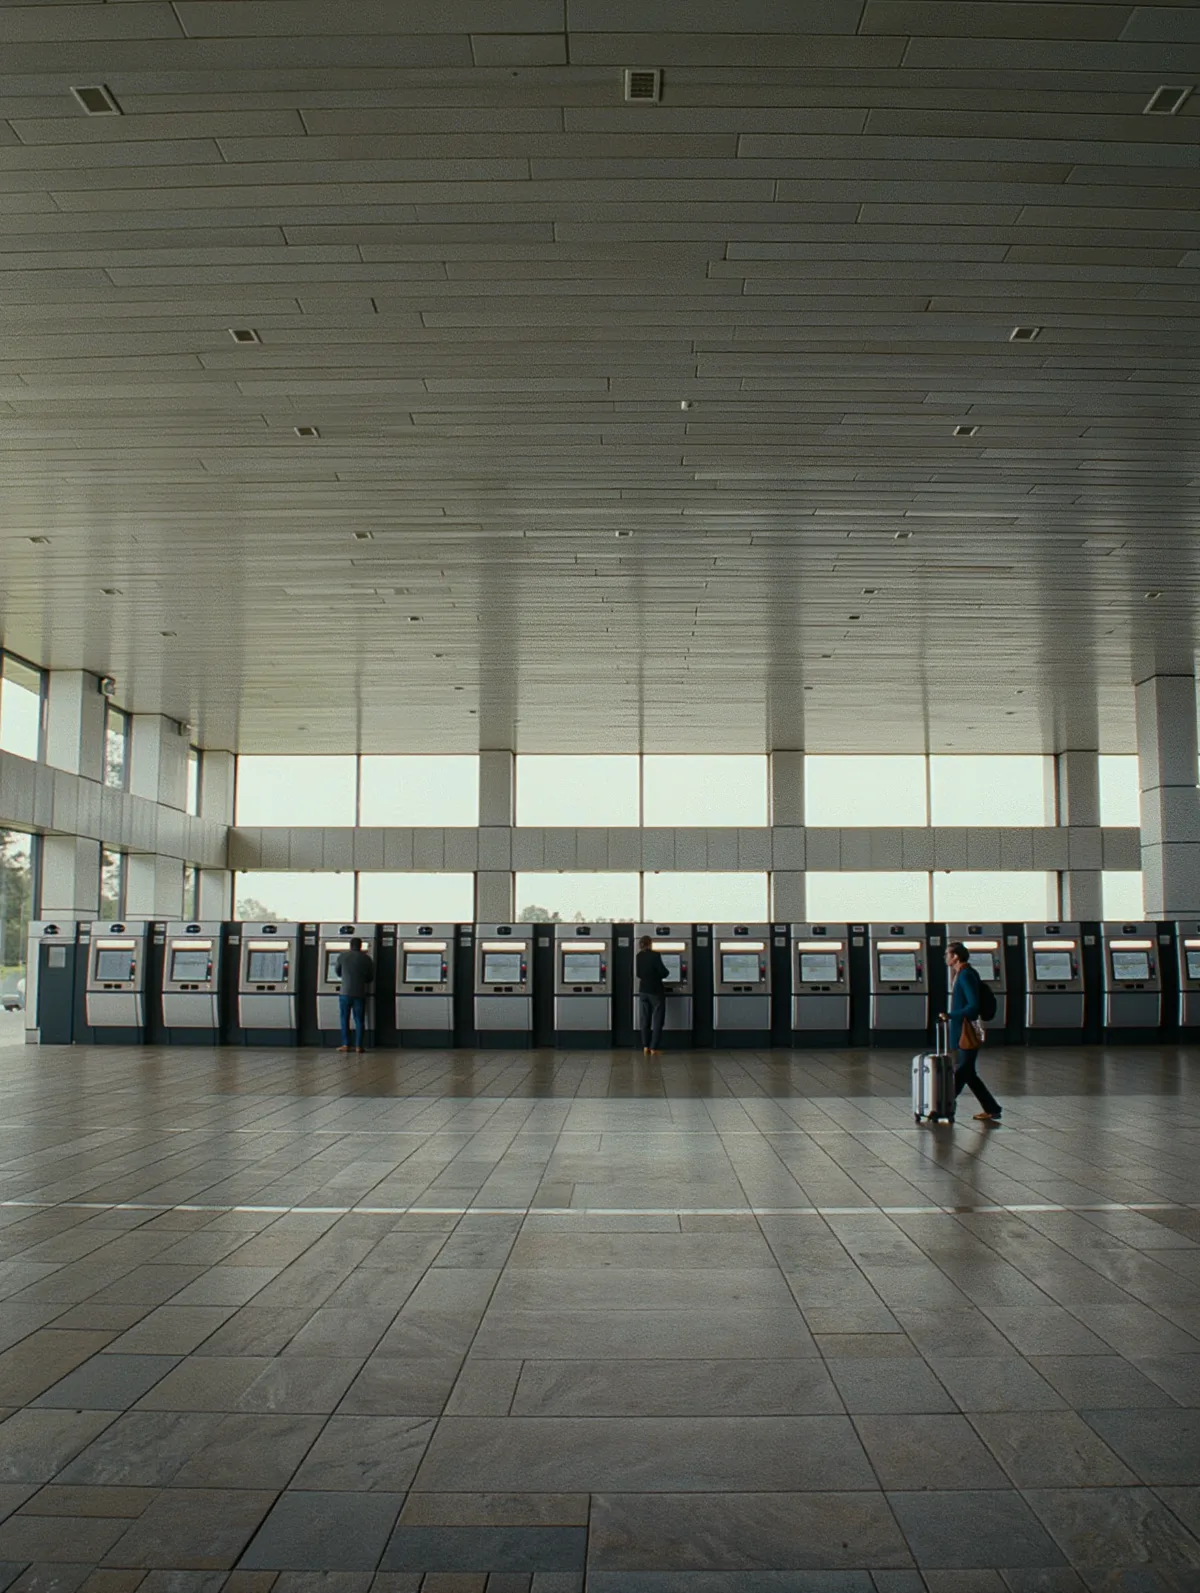
Keep queues short at ticket machines
Queue length and wait time at ticket machines and service desks, so staff respond as lines build.
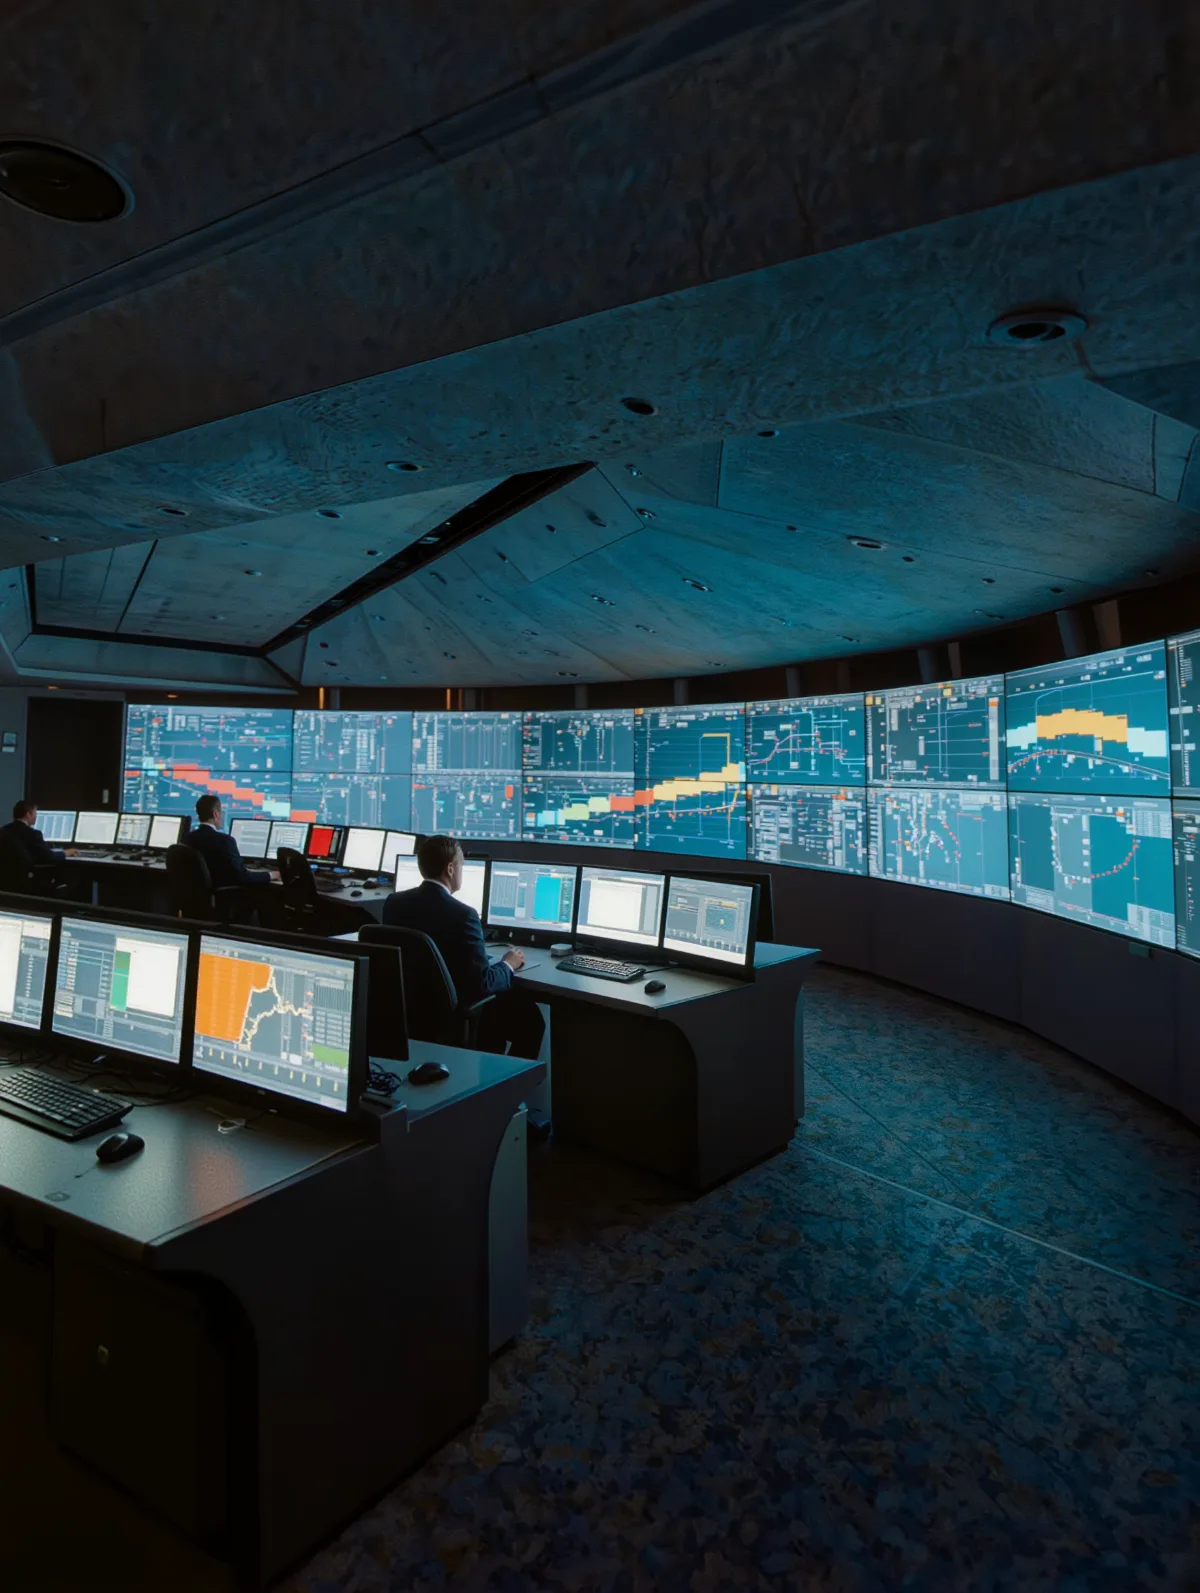
Give the control room a live picture
Q-INSIGHTS dashboards with color-coded thresholds alert staff when a zone crosses its limit.
Detect. Track. Analyze. Act.
Quanergy 3D LiDAR measures millions of 3D points per second. Q-TRACK turns them into anonymous passenger tracks, and Q-INSIGHTS turns the tracks into live flow intelligence.
- 1
Detect
360° 3D LiDAR covers wide concourses and platforms with minimal blind spots, in any light or weather.
- 2
Track
Q-TRACK follows every passenger with centimeter-level position, speed and direction, tracking up to 1,000 objects at once.
- 3
Analyze
Q-INSIGHTS turns tracks into live occupancy, density maps, queue and wait-time analytics, and throughput KPIs.
- 4
Act
Color-coded thresholds and alerts tell staff when a zone is filling up, so they can open gates, redirect flow or add service.
Flow intelligence with Q-INSIGHTS
Q-INSIGHTS is Quanergy’s cloud analytics platform, built for airports, transportation hubs and other high-traffic environments. It supports live, historical and predictive analysis.
- Live zone occupancy
- Density mapping
- Congestion detection
- Queue length and wait time
- Throughput analytics
- SLA alerts with thresholds
- Hourly, daily and monthly KPIs
- Historical benchmarking
- Anomaly detection
Proven where passengers move through hubs
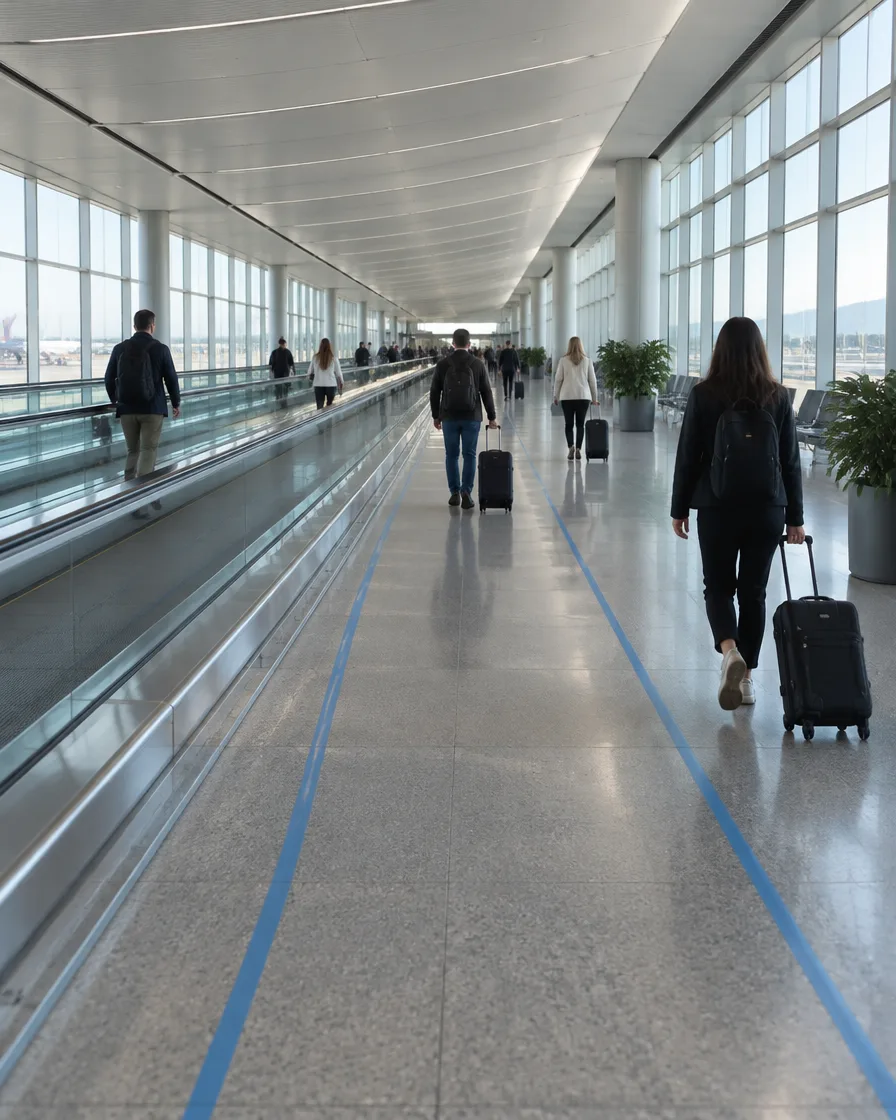
Vancouver International Airport (YVR)
YVR selected Quanergy to analyze footfall through its terminal. Using Quanergy 3D LiDAR sensors and Q-TRACK perception software, YVR identifies and tracks passengers to streamline check-in and improve security clearance efficiency.
“We have harnessed the power of real-time insights, gaining a deep understanding of passenger volumes and the associated wait times at different stages of their journey through the terminal.”Jason Williams, Manager, Innovation & Technology Group, YVR
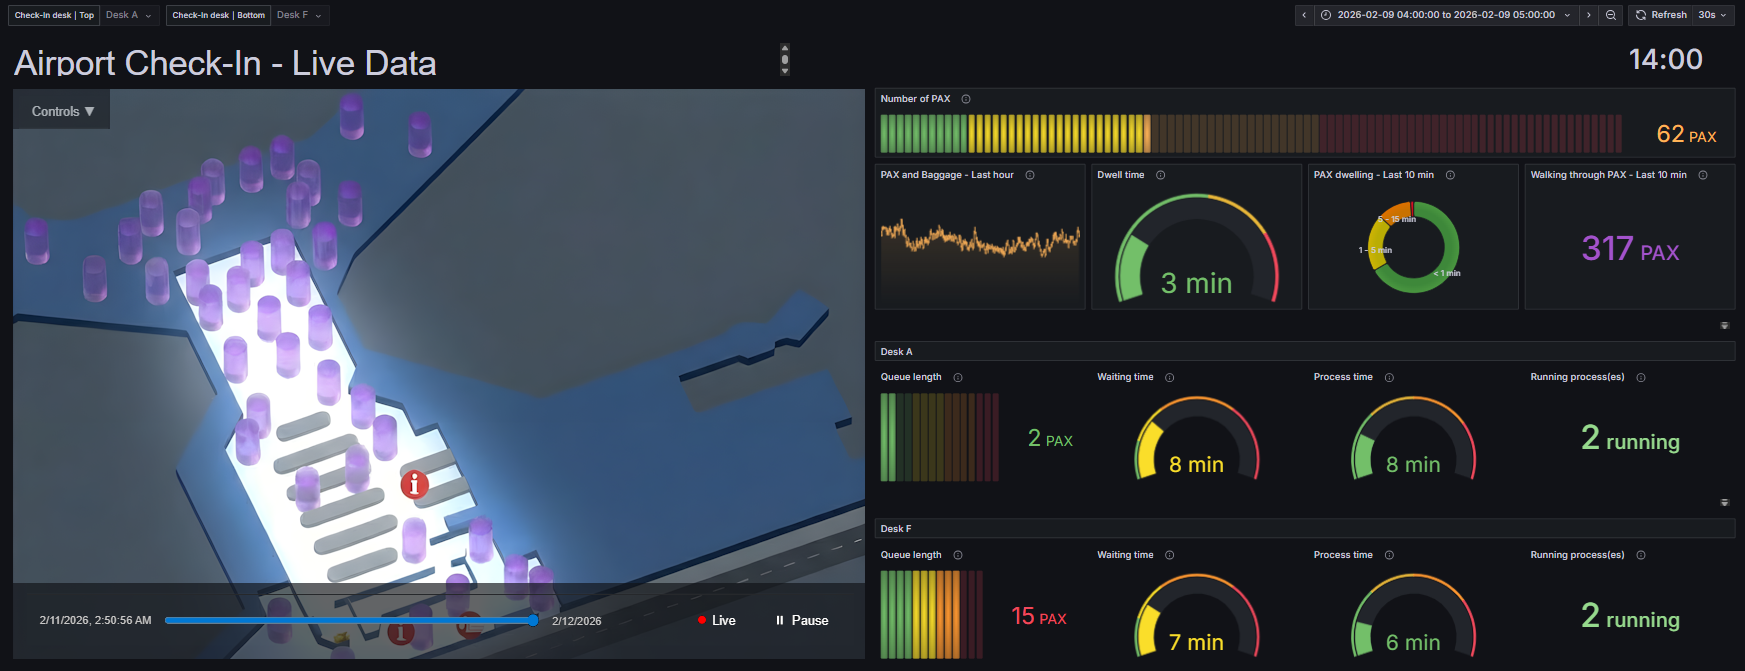
Q-INSIGHTS for transportation hubs
The same analytics run across concourses, gate lines and platforms: real-time flow monitoring, zone occupancy, density mapping and SLA alerts, with hourly, daily and monthly KPI dashboards for planning.
- Live occupancy and congestion detection
- Queue length, wait time and throughput
- Color-coded thresholds and alerts
Protecting tracks, tunnel portals and yards? See how 3D LiDAR secures transit infrastructure.
Transit station passenger flow with 3D LiDAR: common questions
How is 3D LiDAR used in transit stations?
Quanergy 3D LiDAR tracks passengers anonymously across concourses, platforms, fare gates, stairs and escalators. Operators use the data for live crowding alerts, passenger counts, queue and dwell analytics, and capacity planning.
Does LiDAR identify passengers or capture faces?
No. Quanergy 3D LiDAR captures 3D points, not images or faces, so passengers are counted and tracked anonymously and no personally identifiable information is collected.
Does it work on outdoor platforms and in low light?
Yes. LiDAR provides its own illumination, so tracking works in tunnels, on outdoor platforms at night and in bright sun.
How does the control room see crowding?
Q-INSIGHTS shows live zone occupancy, density maps and queue conditions on map- and zone-based dashboards, with color-coded thresholds and alerts when a zone crosses its limit.
Can it count passengers at fare gates and entrances?
Yes. LiDAR counts people in and out at each gate line and entrance, and reports throughput by hour, day and month for planning.
Does Quanergy also secure tracks and tunnels?
Yes. Track intrusion, tunnel portals and yard security are covered on the Transportation Security page.
See how passengers really move
Tell us about your stations, platforms and peak periods. Our team will map where 3D LiDAR gives you live crowding, counts and flow data.