

Updated July 28, 2026
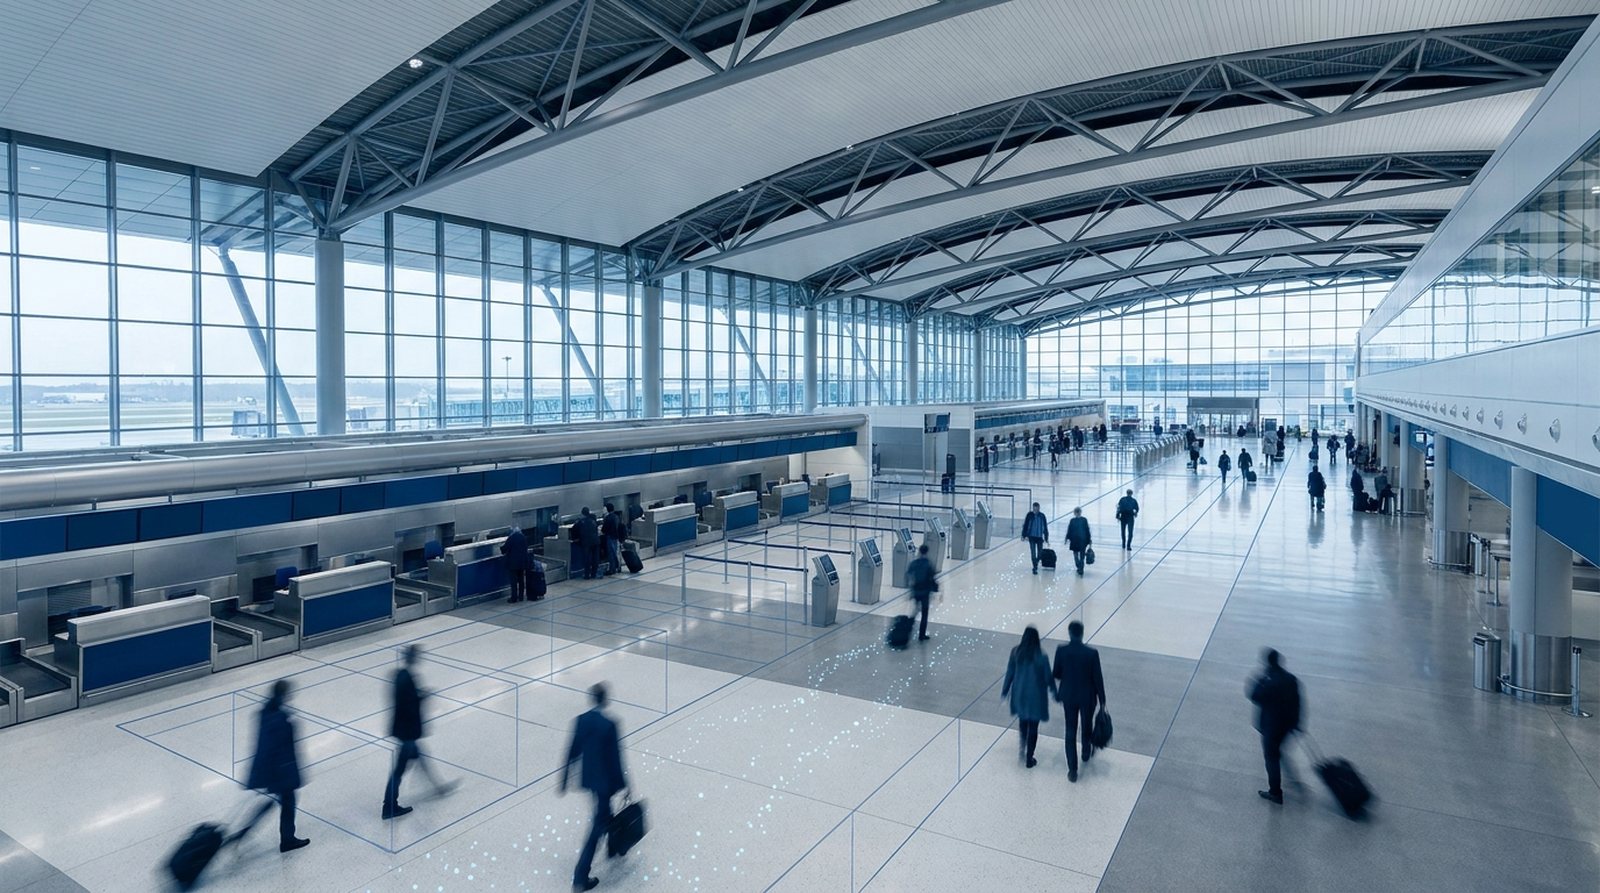
Airport terminal passenger flow management is the practice of measuring how people actually move through a terminal. It covers queue lengths, wait times, occupancy, dwell time, and throughput, and uses that data to deploy staff, open and close lanes, adjust concessions, and improve the passenger experience. 3D LiDAR provides that measurement anonymously, in real time, without cameras and without identifying anyone.
Most terminals still run on a mix of manual queue counts, gate agent radio traffic, and after-the-fact complaint data. Those inputs arrive late and describe the past. Spatial intelligence changes the timing: operations teams see congestion forming while there is still time to act on it.
Why terminal flow is hard to see without spatial data
An airport terminal is one of the most instrumented buildings a passenger will ever walk through, and one of the least understood in terms of movement. Boarding pass scans tell you a passenger reached a checkpoint. Flight schedules tell you when demand should arrive. Neither tells you that lane 4 has been backed up for eleven minutes, that the west restroom corridor is at capacity, or that connecting passengers are pooling at a wayfinding decision point.
The gap costs money in four directions at once: staffing decisions made without demand data, missed connections and their rebooking costs, non-aeronautical revenue lost to passengers stuck in queues instead of shopping, and a passenger satisfaction score that moves for reasons nobody can trace.
What 3D LiDAR actually measures in a terminal
LiDAR sensors emit laser pulses and build a continuously updating three-dimensional point cloud of a space. People and objects appear as shapes with position, height, and trajectory, never as recognizable individuals. From that point cloud, four operational metrics fall out.
Queue length and wait time
The system tracks how many people are inside a defined queue zone and how long it takes an entrant to exit it. That produces an actual measured wait time rather than an estimate extrapolated from throughput. Operations teams can set thresholds and receive alerts before a queue crosses a service-level target.
Occupancy and density
Occupancy is how many people are in a defined area right now. Density is how tightly packed they are within it. Both matter for holdroom management, restroom servicing cadence, gate readiness, and safety thresholds in constrained corridors.
Dwell time
Dwell time measures how long people remain in a zone. In a queue, high dwell is a problem to solve. In a retail concourse, dwell is the leading indicator of spend. The same metric reads as a cost signal in one zone and a revenue signal in another, which is why zone definition matters more than sensor count.
Throughput and directional flow
Throughput counts people crossing a line or boundary over time: passengers per hour through a checkpoint lane, or arrivals into a baggage hall. Directional flow shows the paths people actually take between points, which routinely differs from the paths the wayfinding assumes they will take.
Privacy-first spatial intelligence: what the sensors do and do not capture
This is the first question airport legal and privacy teams ask, so it is worth answering plainly.
3D LiDAR captures spatial geometry. It measures where a shape is, how tall it is, and where it is heading. It does not capture facial images. Quanergy solutions do not perform facial recognition and do not perform biometric identification. There is no facial template, no gait signature, and no identity match against any database.
The practical consequences for an airport:
- The data is anonymous at the sensor level, not anonymized after the fact through a redaction step that can be reversed or misconfigured.
- Privacy review gets simpler. Because no personally identifiable imagery is generated, the privacy impact assessment for a flow-analytics deployment is a materially different conversation than one involving cameras.
- It works where cameras are unwelcome. Restroom approach corridors, prayer rooms, nursing rooms, and medical areas can be covered for occupancy and flow without capturing images of people.
- Lighting is irrelevant. LiDAR is an active sensor, so performance does not depend on ambient light. That matters in jet-bridge transitions, night operations, and glare-heavy curbside glass.
Privacy-first is not a compliance footnote here. It is the reason this data can be collected in zones where visual surveillance is either prohibited or politically untenable.
Five terminal zones where flow data pays off first
Curbside and check-in
Curb dwell, drop-off congestion, and check-in queue depth by carrier. The operational lever is staffing and lane allocation during peak banks.
Security screening
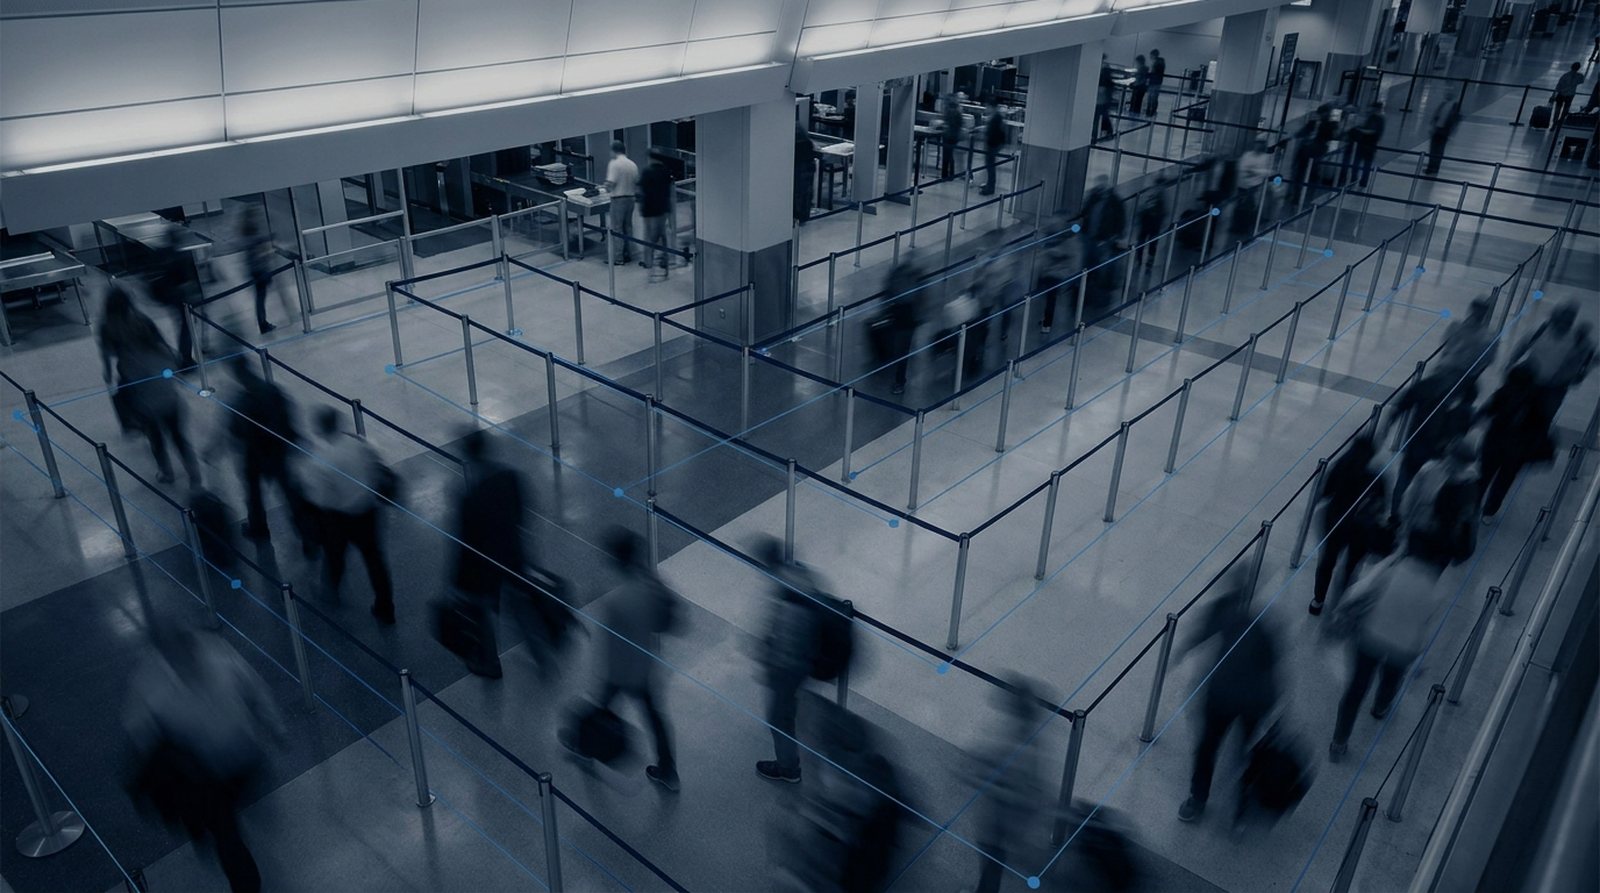
The highest-visibility queue in the building. Measured wait time per lane supports dynamic lane opening, staffing hand-offs, and accurate wait-time displays that passengers actually trust.
Immigration, customs, and connections
Arrivals surges are schedule-driven and therefore predictable, but only if you have historical flow data to predict from. Connection-path flow data also identifies where transferring passengers hesitate or take the wrong route.
Concessions, retail, and holdrooms
Foot traffic, dwell, and capture-rate patterns inform lease negotiations, tenant mix, and hours of operation. This is where flow data stops being a cost-control tool and becomes a non-aeronautical revenue argument.
Baggage claim
Carousel-area occupancy and dwell reveal where wait perception and actual delivery time diverge, and when staffing at oversize or service desks is under-resourced.
Start with one zone tied to a metric someone is already accountable for. Terminal-wide instrumentation as a first move is the most common way these programs stall. See more crowd management applications across other high-traffic environments.
From sensor to decision: Q-TRACK and Q-INSIGHTS
Q-TRACK
Q-TRACK is Quanergy's 3D LiDAR detection and tracking solution. It handles the sensing layer, detecting, classifying, and continuously tracking people and objects across a monitored space, including 360-degree coverage configurations for open concourse areas. It is the layer that turns physical space into structured, anonymous movement data.
Q-INSIGHTS
Q-INSIGHTS is Quanergy's cloud-based 3D spatial intelligence analytics platform. It takes the movement data and turns it into what operations teams actually use: real-time visibility into occupancy, queue conditions, and throughput, plus historical trend analysis for planning, staffing models, and capital justification. More on Q-INSIGHTS for passenger flow analytics.
The division of labor is worth understanding before a vendor conversation. Q-TRACK answers what is happening in this space right now. Q-INSIGHTS answers what should we do about it, and what happened last Tuesday at 6 a.m.
Building the internal business case
Flow analytics projects get approved when they are tied to a number someone already owns. In practice, four arguments carry the most weight with an airport board or executive committee:
- Labor efficiency. Staffing to measured demand instead of to schedule assumptions.
- Non-aeronautical revenue. Dwell and capture-rate data supports concession performance and lease terms.
- Passenger experience metrics. ASQ scores and wait-time complaints become traceable to specific zones and times.
- Capital planning. Before committing to a terminal expansion, measured flow data can identify whether the constraint is square footage or process design. This is often the largest-dollar argument available.
A note on cost comparisons: LiDAR-versus-camera cost claims circulate widely in this market, including in Quanergy's own earlier material. Any figure you carry into a board presentation should be rebuilt against your own terminal's square footage, existing cabling and power infrastructure, and licensing model.
What a phased rollout looks like
Phase 1: Define the operational question
One zone, one metric, one accountable owner. "We need to know actual checkpoint wait time by lane" is a project. "We want terminal analytics" is not.
Phase 2: Instrument one zone
Sensor placement, coverage validation, and zone definition. Zone boundaries determine what the metrics mean, so operations should own that definition, not the integrator.
Phase 3: Integrate and operationalize
Feed the data where decisions already happen: the operations dashboard, the daily brief, the wait-time display. Data that lives only in a vendor portal does not change behavior.
Phase 4: Expand by value
Extend to the next zone based on demonstrated results, not on coverage-map completeness.
Frequently asked questions
Does 3D LiDAR use facial recognition?
No. Quanergy 3D LiDAR solutions do not perform facial recognition and do not perform biometric identification. The sensors capture spatial geometry, meaning position, height, and movement. They do not capture facial images or biometric templates. There is no identity match against any database.
How is 3D LiDAR different from camera-based people counting?
Cameras capture images that may contain personally identifiable information, which brings privacy review, retention policy, and consent obligations. LiDAR captures anonymous point-cloud geometry instead. LiDAR also operates independently of ambient lighting and provides native height and depth information, which supports more reliable separation of individuals in dense groups than a flat 2D image.
What can an airport actually measure with it?
Queue length and measured wait time, real-time occupancy and density, dwell time by zone, throughput across defined boundaries, and directional flow paths between points in the terminal.
Where should an airport deploy sensors first?
Start with a single zone attached to a metric someone is already accountable for, most often the security checkpoint queue or a check-in hall. Terminal-wide deployment as a first phase is the most common reason these programs lose momentum before showing value.
Can it integrate with systems we already run?
Yes. Q-INSIGHTS is designed to deliver flow data into existing operational workflows and dashboards rather than requiring teams to work in a separate portal. Specific integration scope should be confirmed against your existing systems during solution design.
Does it work in low light or outdoors?
LiDAR is an active sensor that emits its own laser pulses, so it does not depend on ambient lighting and operates in darkness. Outdoor applications including curbside and perimeter zones are supported; specific environmental performance should be validated for your site conditions.
How long before we see usable data?
Once a zone is instrumented and its boundaries are defined, real-time metrics are available immediately. Trend and baseline analysis becomes meaningful after enough operating cycles to cover normal weekly and seasonal variation, typically a matter of weeks rather than months.
For the full solution overview, see 3D LiDAR for airports.